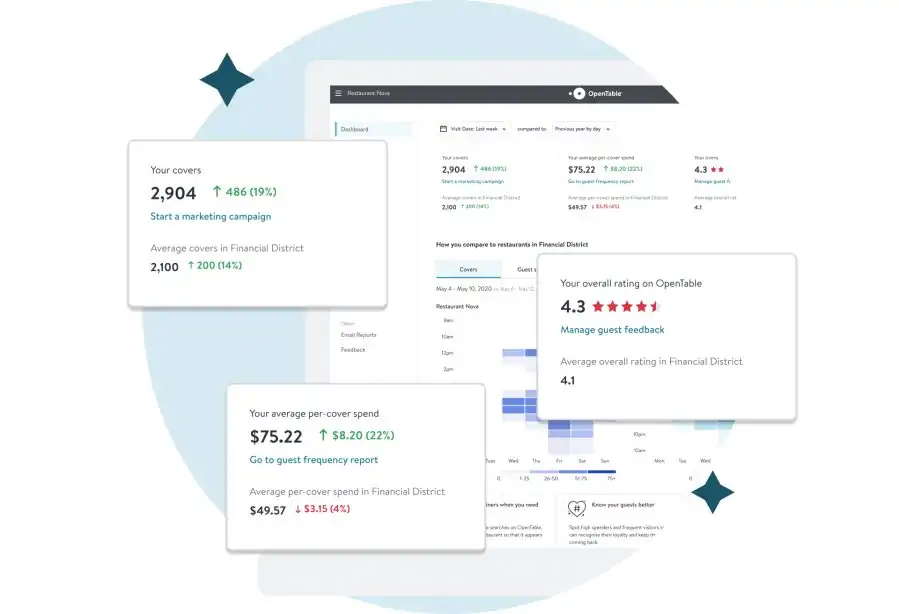
It can be difficult to gauge what’s happening locally and how your restaurant compares to others. Keeping a pulse on all that’s happening in the industry and in your neighborhood also takes a lot of time that’s hard to find.
Restaurants can make more confident decisions if armed with the right information. So we pulled together data and insights on market-level reservations, diner sentiments about eating out, and neighborhood-level reservations.
To help you understand more about diner demand and create a game plan for your own reopening, we connect with diners directly. In our quarterly Diner Insights, people talk about feelings toward eating out again, plus how their habits have changed since the start of the pandemic. The survey revealed a willingness to pay and tip more during the pandemic, as well as the importance of safety precautions to ensure diners and staff are well-protected at your restaurant.
Since dining and reservations can vary drastically from one market to the next, specific and local data and insights are even more valuable. For example, are slower Tuesday nights typical in your neighborhood, or is your restaurant specifically seeing fewer covers?

OpenTable restaurants can tap into benchmark reporting to get an overview and compare with other local OpenTable restaurants in their community.
With a global restaurant base of thousands of restaurants, OpenTable is uniquely able to provide anonymized and aggregated information on cover, spend, and feedback data from local restaurants to provide insight about your neighborhood.
It’s never been easier to uncover gaps and successes in performance, then quickly navigate to OpenTable tools to take actions for improvement, with the assurance that your own restaurant’s performance and participation is also anonymous.
Benchmark reporting is available across all OpenTable plans. Learn more about how it can help your business.
Already an OpenTable customer? Access your benchmark reporting overview in OpenTable here.


