
In the restaurant business, there’s more than one measurement of performance that matters when you’re gauging success. Sure, hard revenue is a straightforward and important way to look at it—but it’s far from the only one. Looking at some other critical key metrics can provide you with a 360-degree view of your restaurant’s performance.
Even when staffing and financial resources are stretched thin, there’s a lot you can do to build a more profitable, efficient restaurant if you have the right stats informing your decisions. Here are some key numbers to review to optimize your restaurant’s performance.
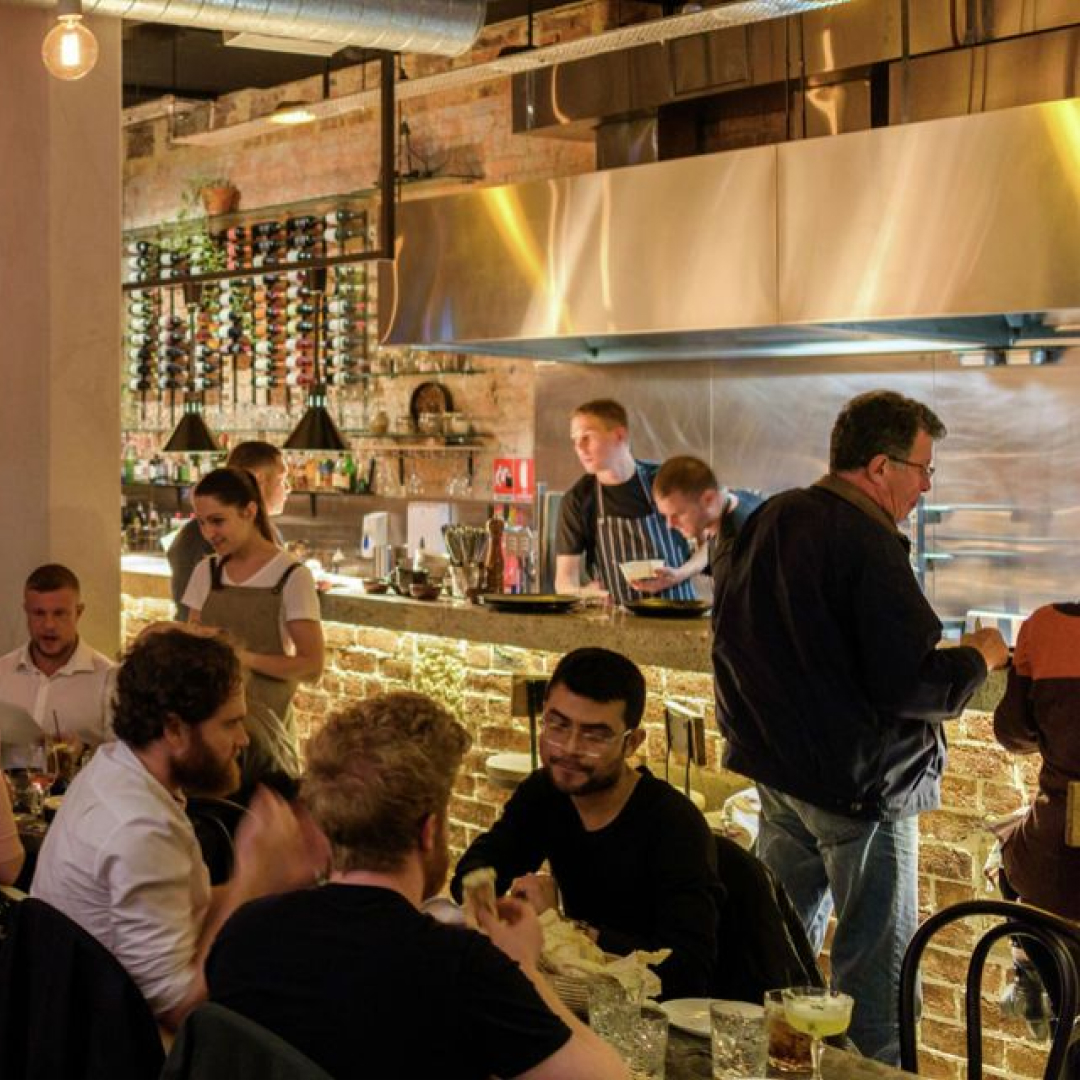
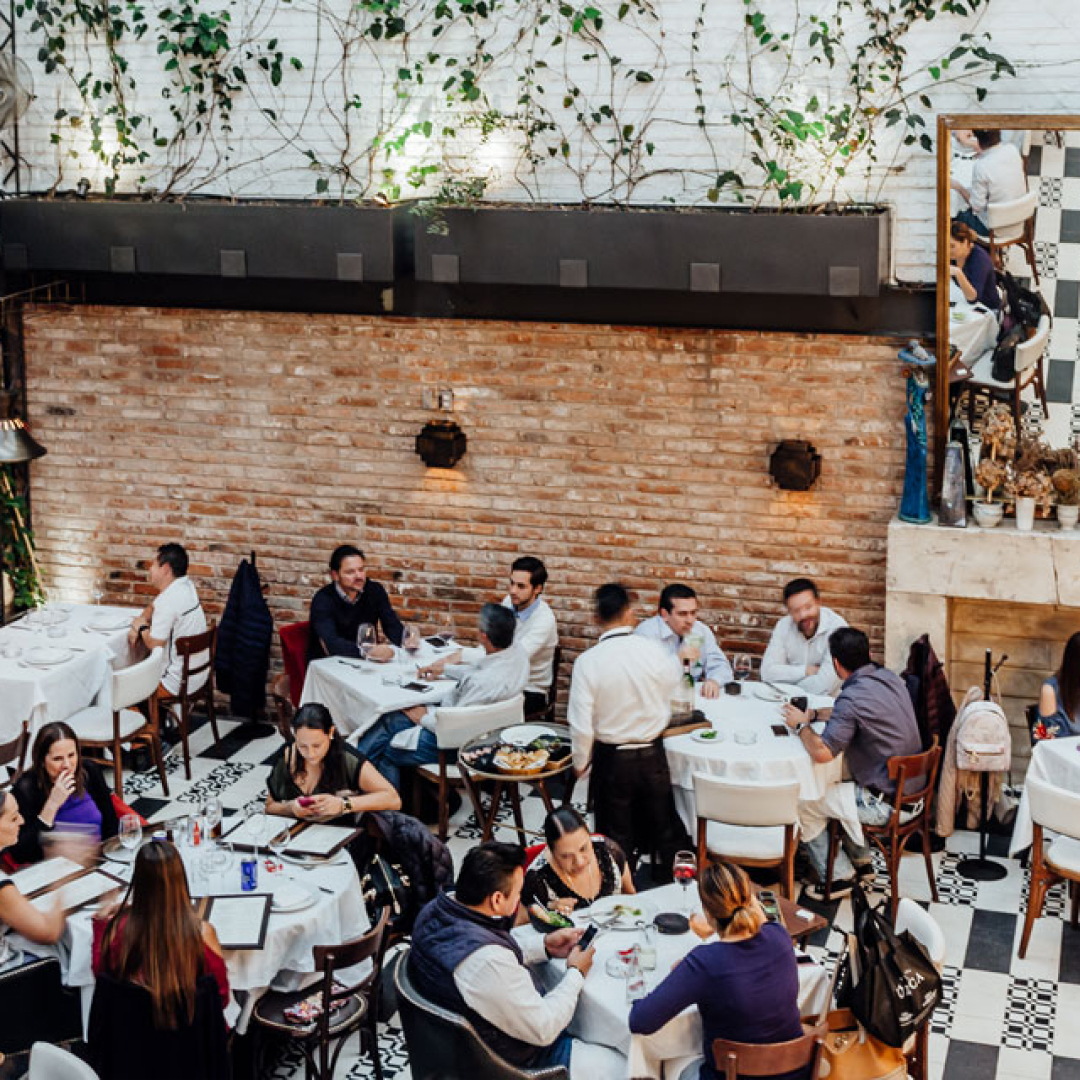
Maximizing your covers
Occupancy
Knowing the occupancy numbers is an important part of understanding how a restaurant is really doing. Simply put, occupancy refers to the number of total seats that are filled, expressed as a percentage. Here’s how to calculate it:
Number of seated guests present at a given time / Total number of available seats = Occupancy rate
And here’s an example, if your restaurant seats 100 guests and 75 people are seated at 7 p.m.:
75 / 100 = 75%
The goal is maintaining 100% occupancy, or as close as possible to it, throughout the shift. Staying on top of occupancy numbers can help you uncover opportunities for growth. You can discover where you need to work on putting more diners in seats through increased marketing as well as when to consider taking fewer bookings. For example, it might be a good idea to adjust the book to even out slower periods of a shift with the busiest peak times. Looking back over weeks past can help you forecast occupancy trends.
Of course, revenue is the ultimate bottom line, but occupancy numbers can be a more precise indicator of where there’s room to grow. Occupancy fluctuates throughout the shift, so total covers don’t show a complete picture. If you compare dinner occupancy to lunch, for example, an opportunity to improve occupancy at one service may reveal itself.
In a nutshell, running and reviewing regular shift occupancy reports can help determine if you should tweak your availability settings or launch a strategic marketing campaign in order to minimize those empty seats.
Turn times
One of the toughest parts of the restaurant business is unpredictability. Not knowing how long a given group of guests will remain stationed at their table is one such variable that can bleed efficiency from a shift.
Evaluating turn times—from the moment the guest is seated until the table is ready to be sat again—is crucial to improving restaurant performance. You can compare your ideal turn times to the actual turn times you are seeing in the dining room. You can look at how they fluctuate on different days (Friday vs Wednesday) and different reservation types. (Early bird diners often have faster turn times than guest dining at prime time, for example.)
If you look at turn times on a regular basis and notice them ticking up, it’s time to dig a little deeper to discover what needs to happen to move toward the restaurant’s ideal turn time. The ideal turn time depends on a number of factors, including the style of cuisine, the typical number of courses, and other factors that vary from business to business.
If you notice your average turn time is getting longer, it doesn’t necessarily mean you need to hire more people. Sometimes there are jam-ups in the kitchen because a host seats too many tables at once. If guests order all entrees and no appetizers, it can overload a particular station, slowing everything down. It’s also possible you need to adjust your expectations and plan for longer turn times.
You won’t know until you take a closer look at all the possible factors. After assessing the situation, you may decide that adding more staff is the right move. Ultimately, becoming a turn time expert allows you to make adjustments to get more table turns without changing your hours, working more, or increasing wait times.
Cancellations and no-show rate
Few things hurt more than last-minute cancellations and flat-out no-shows. And the reality is, OpenTable data shows a staggering 28% of Americans say they haven’t shown up for a reservation in the past year.
Though it can be painful to look at, calculating your no-show rate can be the first step to improving the situation. Here’s how to calculate it:
No-show covers / Total covers = No-show rate
No-show covers x Average price per head = Dining revenue loss
And here’s an example if your restaurant had 400 total covers:
15 no-show covers / 400 total covers = 4% no-show rate
15 no-show covers x $30 = $450 in lost dining revenue
There’s nothing like hard numbers to motivate you to work on strategies that drive down cancellations and no-shows, including strategic overbooking, texting confirmations, requiring a credit card, and offering prepaid experiences to name a few. Using an online waitlist and availability alerts, adjusting the reservation book as circumstances change, and announcing available tables to fans on social media can also help fill those last-minute openings.
Local comparison
Comparing seated guest activity, guest spending, reviews, and no-shows to those at other restaurants in your area can paint a vivid picture of how a restaurant is doing overall. OpenTable’s benchmark reporting helps you understand how your performance stacks up to other restaurants in your region. This anonymized and aggregated information helps uncover successes and where improvement is needed.
Know the value of each guest
Average guest spend
This is likely a number most restaurants are already tracking, but knowing the average just scratches the surface of the available information on guest spending. Drilling down in finer detail can be a revealing exercise that yields tangible results.
When you crunch the numbers, you may learn that late-night guests spend more than their early-bird counterparts. Pinpointing trends like these help identify upsell opportunities. Combining this information with guest notes helps you provide better hospitality by anticipating what people want while increasing revenue.
Cost of goods sold (COGS)
Many restaurateurs are less than crystal clear on food costs, a situation that proves hugely costly over the course of a year if the cost of ingredients creeps up. Knowing the cost of goods sold can help. This stat is the total cost required to make each of your menu items. It represents the restaurant’s inventory over a certain time. To figure it out, you make a detailed record of inventory levels during a specified time window, plus whatever else you purchase during that time. Add up the cost of the inventory used plus new spending, and you’ll get COGS.
Staying on top of the COGS with the help of technology helps you spot ways to make the most of your resources by choosing less expensive, high-quality seasonal ingredients, extending the shelf-life of your inventory, or negotiating with distributors. Cutting your COGS can increase profitably.
Overhead rate
Having a firm grasp on how much it costs to run a restaurant is essential. Add up all fixed costs like rent, utilities, insurance, loan payments, and salaries to determine your overhead rate. These fixed costs don’t fluctuate, but knowing what it amounts to makes it possible to budget and plan for fluctuating costs, including labor. Smart scheduling practices and employing an on-call staff strategy can help make sure you always have staffing coverage but reduce surpluses for slow services.
The easy-to-read, real-time reporting on these metrics that you get with OpenTable helps you better understand your restaurant’s performance. These insights can shape your business strategies, help you provide better hospitality, and increase revenue. Armed with these numbers, you can make better informed decisions for long-term success.